


|
||
|
||
With measurement networks rapidly evolving up to hundreds of nodes (see RIPE Atlas as a prominent recent example), it becomes more and more challenging to extract useful visualisations from tons of collected data. At the same time, geographical information related to Internet measurements (either known or inferred with state-of-the-art techniques) can be exploited to build tools based on geography as a common knowledge base.
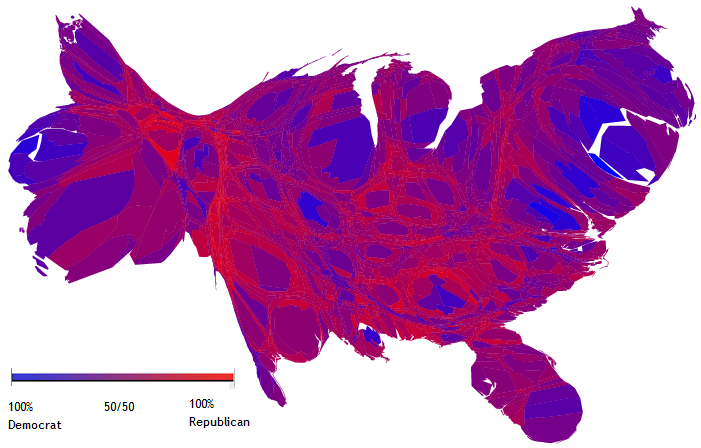
We wanted to develop a tool to visualise different classes of geographically annotated Internet data, e.g., topology, address allocation, DNS and economical data. In cooperation with The Cooperative Association of for Internet Data Analysis CAIDA, we developed a new interactive tool—Caidagram—derived from a decades-old visualisation technique called a cartogram. A cartogram is a map whose geometry is distorted to convey new information. A classic example depicts the United States with geographic distance distorted as a function of the population, coloured by the results of the 2004 presidential elections.
Each Caidagram extends the geographic mapping metaphor to other variables, while attempting to maximise intuitiveness and readability. We used Caidagrams to create interactive animations illustrating data trends over time. We show two examples of how a Caidagram can provide insight into real Internet data.
Methodology and Results
In the first example, we look at round trip times (RTT) between different end points, including one-to-many scenarios where we depict RTTs from different locations to one single endpoint. The common endpoint is normally placed in the centre of concentric circles that represent increasing distances.
In our example, the centre represents K-root (including all anycast instances) and the concentric circles represent RTT values. Countries are placed within the concentric circle that corresponds with the average RTT value of that country. This value was determined by combining the RTT values of all test traffic measurement boxes in that country as measured with the RIPE NCC DNS Monitoring service DNSMON. The Test Traffic Measurements network TTM is a network of measurement devices deployed by the RIPE NCC in various locations all over the world.
In Figure 1, you can see a frame from an animation showing round trip times to the K root server. The countries circling around the center, are those in which we placed more than one RIPE NCC TTM monitoring box: USA, The Netherlands, Italy, Japan, Australia, New Zealand, Switzerland, UK, Germany, Luxembourg, Estonia, Portugal, Austria, Sweden, Czech Republic, Israel, Cyprus. To increase readability, countries on the same continent are shown in the same colour.
In order to keep latency to a minimum, there are K-root instances on most continents and often more than one. However, sometimes a TTM box queries a root server instance that is on a different continent. This will increase the RTT value and places the country further away from the centre of the image as is the case for the US and Australia in our example.
 Figure 1: Caidagram showing RTT values to K-root using DNSMON (Click to Enlarge)
The second example uses a more traditional cartogram technique to compare quantitative per-country Internet statistics, such as the number of Internet addressing resources in a country. The image below distorts the shape of each country, by either inflating or deflating its boundaries, depending on the number of Autonomous Systems (ASes) assigned to organisations in that country. At the same time, the colour indicates what percentage of these ASes are IPv6 enabled which means, the AS announces one or more IPv6 prefixes (red means no IPv6 enabled ASes and green means all ASes are IPv6 enabled).
The US is very inflated because of the many AS numbers assigned. However, you can also see that only around 10% of these ASes are IPv6 enabled. On the other hand, some European countries, most visibly The Netherlands, are shown in light green, which means almost 50% of the ASes are IPv6 enabled. South America and Africa are very small in this image, because not many AS numbers are assigned in these regions. The underlying data for this image is taken from v6asns.ripe.net (see also Networks with IPv6 over Time)
 Figure 2: Caidagram showing IPv6 enabled ASes (Click to Enlarge)
Claudio Squarcella presented Caidagram at RIPE 61 in Rome. The tool is implemented with AJAX for compatibility with most modern web browsers, and uses the Google Web Toolkit and Raphaël, a Javascript library for vector graphics. You can also view a demo version of the tool or look at the source code. Please also see the article contributed by Claudio Squarcella on RIPE Labs ‘Caidagram :Visualising Geographically Annotated Internet Measurements’.
(Please note that this is work in progress and will be improved over time.)
Sponsored byDNIB.com

Sponsored byWhoisXML API

Sponsored byVerisign

Sponsored byRadix

Sponsored byCSC

Sponsored byIPv4.Global

Sponsored byVerisign


A World-Renowned Source for Internet Developments. Serving Since 2002.